Journal Article in IEEE Access
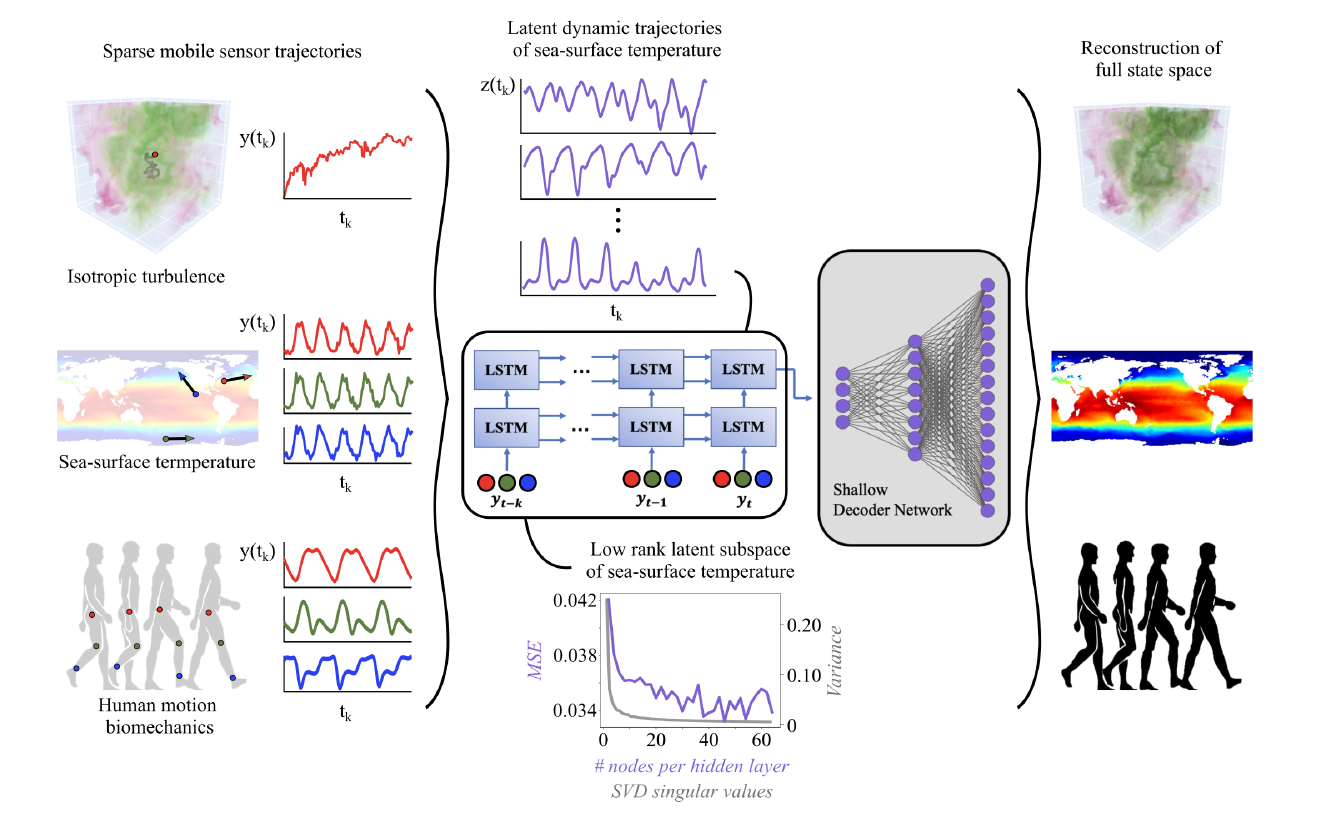
Sensing is a fundamental task for the monitoring, forecasting, and control of complex systems. In many applications, a limited number of sensors are available and must move with the dynamics. Currently, optimal path planning, like Kalman filter estimation, is required to enable sparse mobile sensing for state estimation. However, we show that arbitrary mobile sensor trajectories can be used. By adapting the Shallow REcurrent Decoder (SHRED) network with mobile sensors, their time-history can be used to encode global information of the measured high-dimensional state space.
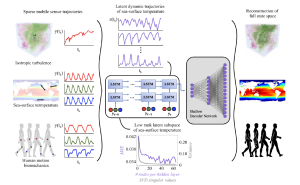 Aim: We leverage sparse mobile sensor trajectories for full-state estimation, agnostic to sensor path.
Methods: Using modern deep learning architectures, we show that a sequence-to-vector model, such as an LSTM (long, short-term memory) network, with a decoder network, dynamic trajectory information can be mapped to full state-space estimates.
Results: We demonstrate that by leveraging mobile sensor trajectories with shallow recurrent decoder networks, we can train the network (i) to accurately reconstruct the full state space using arbitrary dynamical trajectories of the sensors, (ii) the architecture reduces the variance of the mean-squared error of the reconstruction error in comparison with immobile sensors, and (iii) the architecture also allows for rapid generalization (parameterization of dynamics) for data outside the training set. Moreover, the path of the sensor can be chosen arbitrarily, provided training data for the spatial trajectory of the sensor is available.
Interpretation: The time-history of mobile sensors can be used to encode global information of the measured high-dimensional state space.