Journal Article in Journal of Biomechanics
Quantifying individualized rehabilitation responses and optimizing therapy for each person is challenging. For interventions like treadmill training, there are multiple parameters, such as speed or incline, that can be adjusted throughout sessions.
 Aim: This study evaluates if causal modeling and Bayesian Additive Regression Trees (BART) can be used to accurately track the direct effects of treadmill training on gait.
Methods: We developed a Directed Acyclic Graph (DAG) to specify the assumed relationship between training input parameters and spatiotemporal outcomes during Short Burst Locomotor Treadmill Training (SBLTT), a therapy designed specifically for children with cerebral palsy (CP). We evaluated outcomes after 24 sessions of SBLTT for simulated datasets of 150 virtual participants and experimental data from four children with CP, ages 4–13 years old. Individual BART models were created from treadmill data of each step.
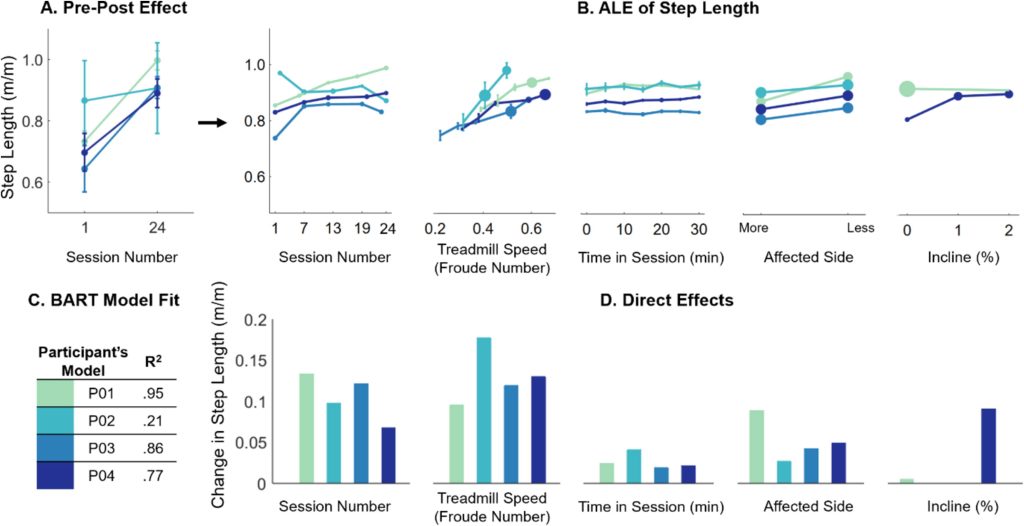
Results: Simulated datasets demonstrated that BART could accurately identify specified responses to training, including strong correlations for step length progression (R2 = 0.73) and plateaus (R2 = 0.87). Model fit was stronger for participants with less step-to-step variability but did not impact model accuracy. For experimental data, participants’ step lengths increased by 26 ± 13 % after 24 sessions. Using BART to control for speed or incline, we found that step length increased for three participants (direct effect: 13.5 ± 4.5 %), while one participant decreased step length (−11.6 %). SBLTT had minimal effects on step length asymmetry and step width.
Interpretation: Tools such as BART can leverage step-by-step data collected during training for researchers and clinicians to monitor progression, optimize rehabilitation protocols, and inform the causal mechanisms driving individual responses.
