Journal article in Gait & Posture
Children with cerebral palsy (CP) have an injury to the central nervous system around the time of birth that affects the development of the brain and spinal cord. This injury leads to changes in gait neuromechanics, including muscle activity and joint kinematics. Transcutaneous spinal cord stimulation (tSCS) is a novel neuromodulation technique that may improve movement and coordination in children with CP when paired with targeted physical therapy.
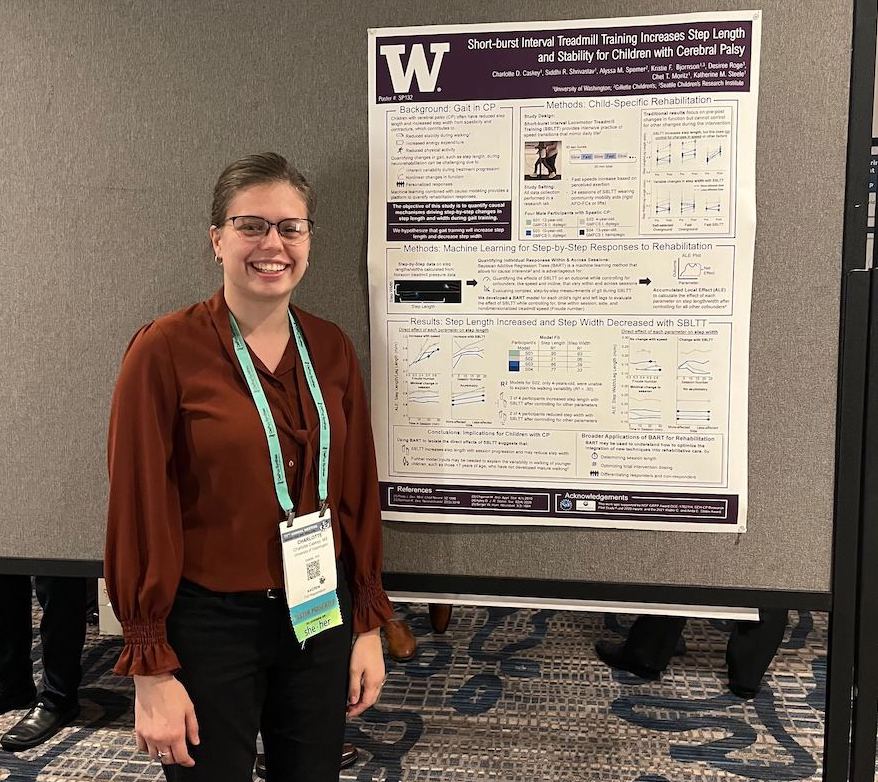
 Aim: How does the combination of tSCS and short-burst interval locomotor treadmill training (SBLTT) affect individual gait neuromechanics in children with CP?
Methods: Four children with CP (4–13 years old), received 24 sessions each of SBLTT only and SBLTT with tSCS (tSCS+SBLTT). Clinical assessments of spasticity and passive range of motion (PROM), as well as biomechanical assessments of joint kinematics, musculotendon lengths, and muscle activity were recorded during overground, barefoot walking. Assessments were taken before and after each intervention, and 8-weeks later.
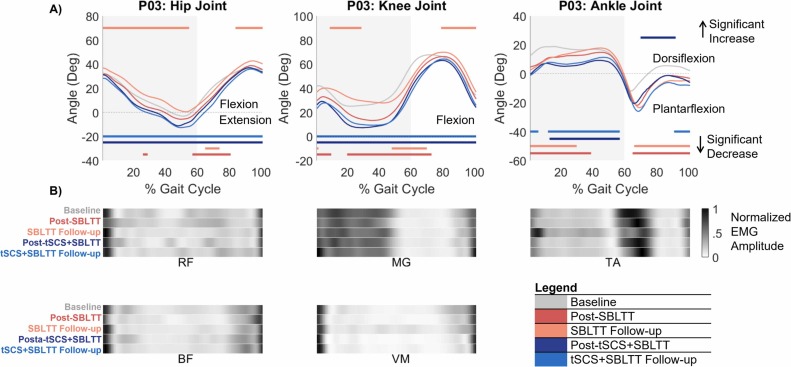
Results: The combination of tSCS+SBLTT led to greater increases in hip and knee extension than SBLTT only for three participants. Three children also became more plantarflexed at the ankle during stance after tSCS+SBLTT compared to SBLTT only. While tSCS+SBLTT reduced spasticity, these changes were only weakly correlated with changes in musculotendon lengths during gait or PROM, with the largest correlation between change in gastrocnemius operating musculotendon length during fast walking and gastrocnemius spasticity (R2 = 0.26) and change in plantarflexor PROM and gastrocnemius spasticity (R2 = 0.23).
Interpretation: Children with CP used a more upright, less crouched posture during gait after tSCS+SBLTT. Large reductions in spasticity after tSCS+SBLTT were only weakly correlated with changes in kinematics and PROM. Understanding the mechanisms by which tSCS may affect gait for children with CP is critical to optimize and inform the use of tSCS for clinical care.