 Congratulations to Dr. Momona Yamagami on earning her Doctorate in Electrical and Computer Engineering! Dr. Yamagami’s PhD thesis dissertation was titled Modeling and enhancing human-machine interaction for accessibility and health. Congratulations and best of luck as you move forward as a CREATE Postdoctoral Researcher.
Projects
EC Kuska, N Mehrabi, MH Schwartz, KM Steele (2022) “Number of synergies impacts sensitivity of gait to weakness and contracture”
Journal Article in Journal of Biomechanics
Muscle activity during gait can be described by a small set of synergies, weighted groups of muscles, that are theorized to reflect underlying neural control. For people with neurologic injuries, like cerebral palsy or stroke, even fewer synergies are required to explain muscle activity during gait. This reduction in synergies is thought to reflect altered control and is associated with impairment severity and treatment outcomes. Individuals with neurologic injuries also develop secondary musculoskeletal impairments, like weakness or contracture, that can impact gait. Yet, the combined impacts of altered control and musculoskeletal impairments on gait remains unclear.
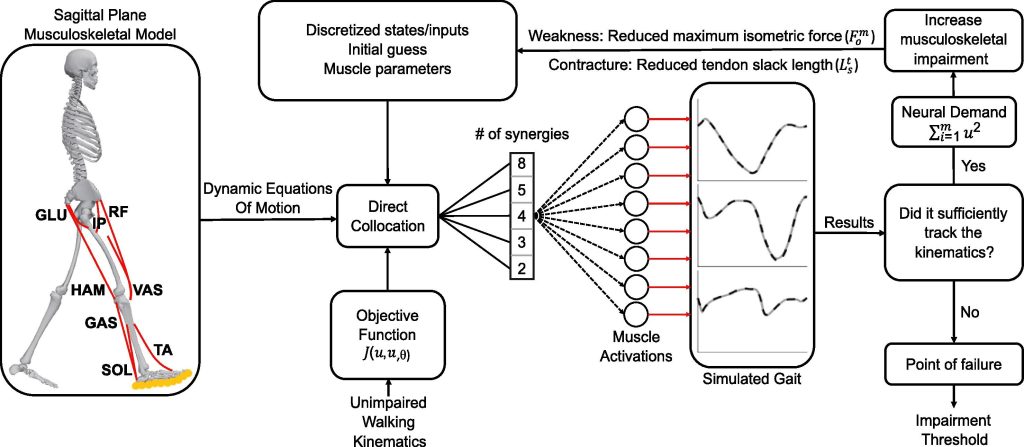 Aim: In this study, we use a two-dimensional musculoskeletal model constrained to synergy control to simulate unimpaired gait.
Methods: We vary the number of synergies, while simulating muscle weakness and contracture to examine how altered control impacts sensitivity to musculoskeletal impairment while tracking unimpaired gait.
Results: Results demonstrate that reducing the number of synergies increases sensitivity to weakness and contracture for specific muscle groups. For example, simulations using five-synergy control tolerated 40% and 51% more knee extensor weakness than those using four- or three-synergy control, respectively. Furthermore, when constrained to four- or three-synergy control, the model was increasingly sensitive to contracture and weakness of proximal muscles, such as the hamstring and hip flexors. Contrastingly, neither the amount of generalized nor plantarflexor weakness tolerated was affected by the number of synergies.
Interpretation: These findings highlight the interactions between altered control and musculoskeletal impairments, emphasizing the importance of measuring and incorporating both in future simulation and experimental studies.
Congratulations to Zahra McKee on being named a Mary Gates Scholar
 Zahra was selected from a highly competitive application pool to receive the Mary Gates Research Scholarship. The scholarship allows students to focus more attention and time on their research projects while being supported financially for two quarters. Zahra will continue working on a mixed-methods study investigating the status of prescription, initial use, and impacts of mobility aids for children under 5 with cerebral palsy. Congratulations!
Congratulations, Nicole! Nicole Zaino passes her Ph.D. General Exam
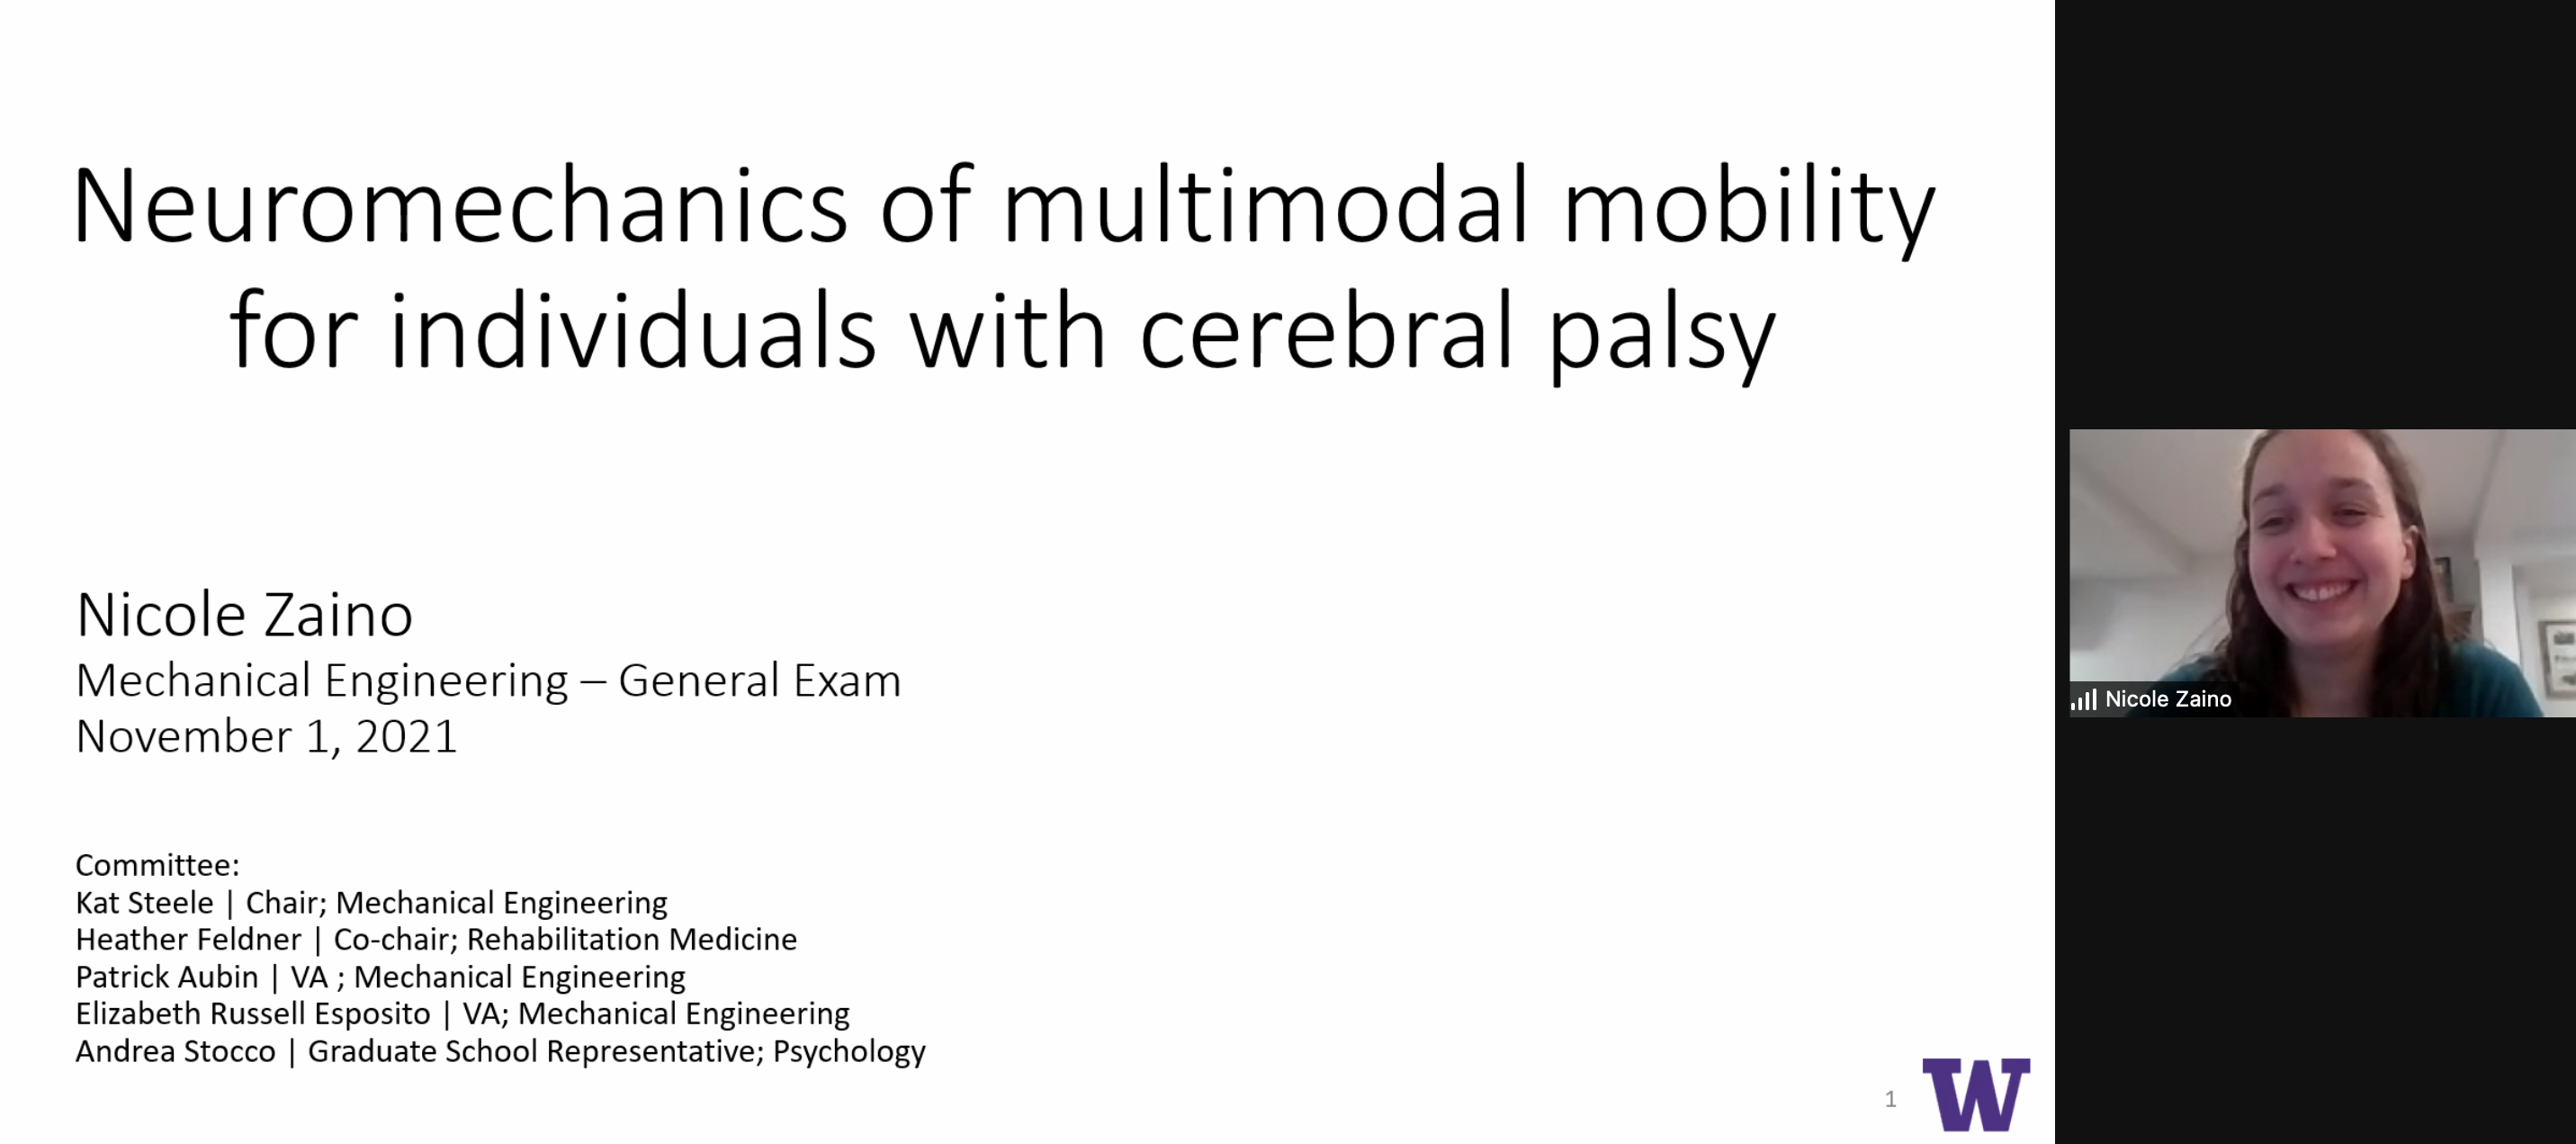 Congratulations to Nicole Zaino for passing her General Exam!
Nicole’s proposed work titled Neuromechanics of multimodal mobility for individuals with cerebral palsy was approved by her Ph.D. committee. Woot! Woot! Go Nicole!
Congratulations, Megan! Megan Ebers passes her Ph.D. General Exam
Congra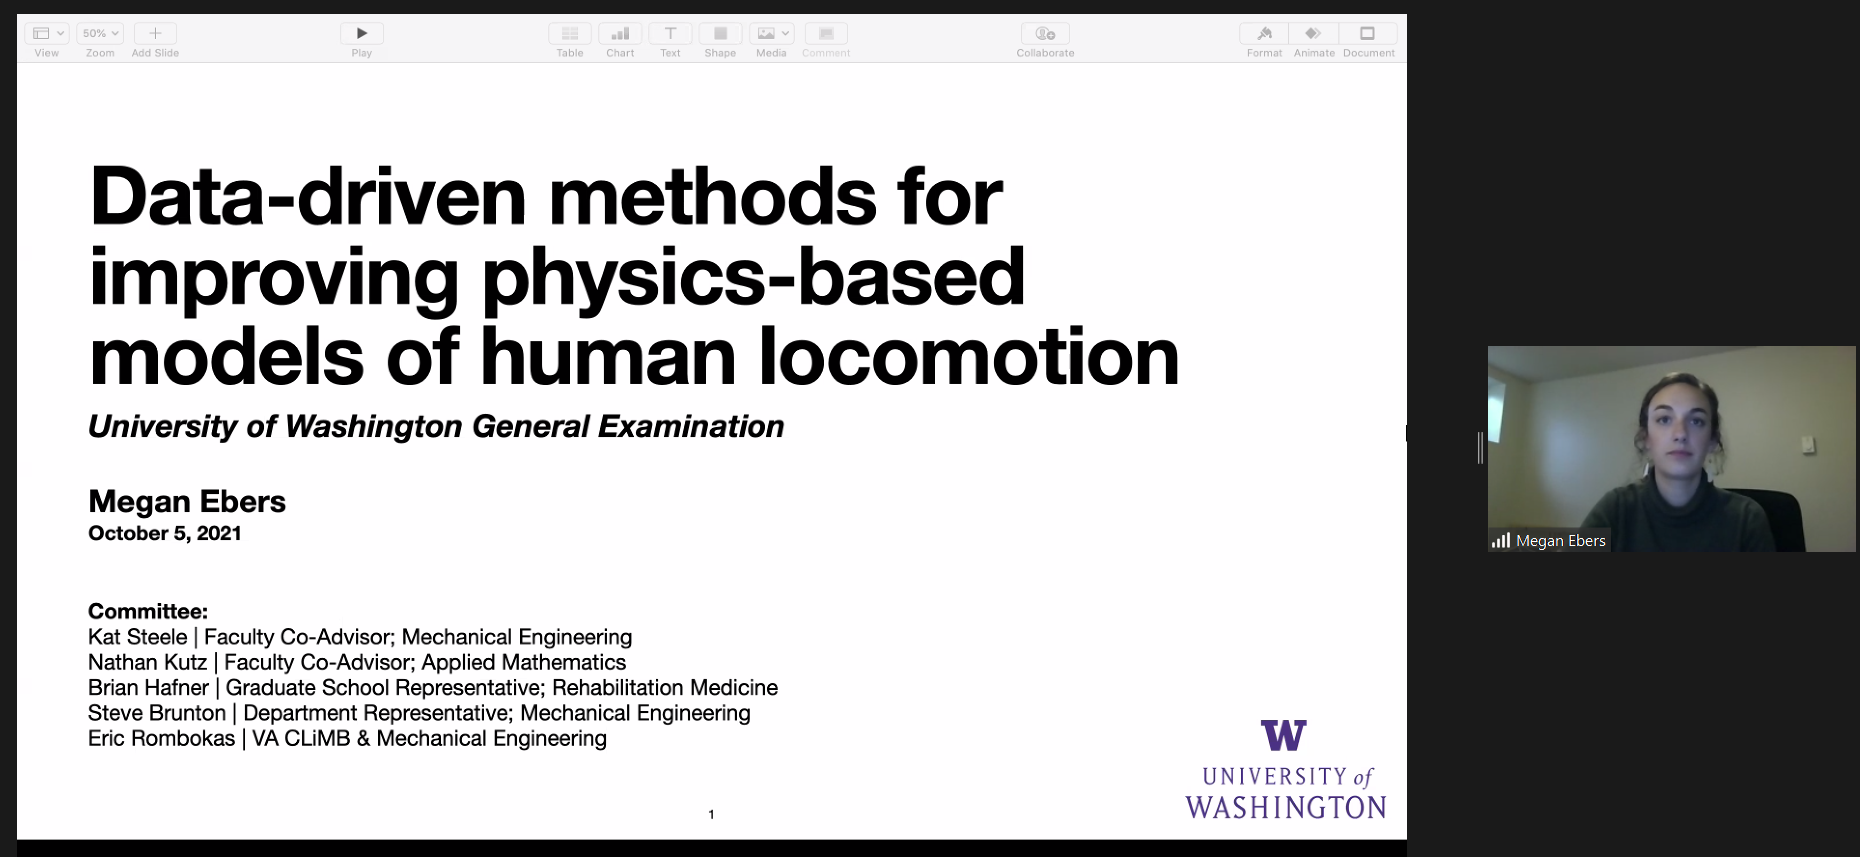 tulations to Megan Ebers for passing her general exam!
Megan’s proposed work titled Data-driven methods for improving physics-based models of human locomotion was approved by her Ph.D. committee. Way to go Megan!