MR Ebers, MC Rosenberg, JN Kutz, KM Steele (2023) “A machine learning approach to quantify individual gait responses to ankle exoskeletons”

Journal Article in Journal of Biomechanics:

Physiological and biomechanical responses to mechanical assistance from wearable technology are highly variable, especially for clinical populations; tools to predict how users respond to different types of exoskeleton assistance may optimize the prescription process and uncover underlying mechanisms driving locomotor changes in the context of personalized wearable/assistive technology.

Aim: The purpose of this study was to determine if a discrepancy modeling framework could quantify individual-specific gait responses to ankle exoskeletons.

Method: We employ a machine learning technique — neural network based discrepancy modeling — on gait data from 12 non-disabled adults to capture within-participant differences in walking dynamics without vs. with a bilateral passive elastic ankle exoskeletons applying 5 N-m/deg of torque. We fit three models: Nominal gait (no exo), Exo, and Discrepancy. Then, post-fitting, we extend the Nominal by the Discrepancy Model (Augmented). We hypothesize that if Augmented (Nom+Discrep) can capture similar amount of variability as the Exo model, then it can be inferred that the discrepancy model accurately captures how a user will respond to an exoskeleton — without direct information about that user’s physiology or motor coordination.

Results:While joint kinematics during Exo gait were well predicted using the Nominal model (median 𝑅2 = 0.863 − 0.939), the Augmented model significantly increased variance accounted for (𝑝 < 0.042, median 𝑅2 = 0.928 − 0.963). For EMG, the Augmented model (median 𝑅2 = 0.665 −
0.788) accounted for significantly more variance than the Nominal model (median 𝑅2 = 0.516 − 0.664). Minimal kinematic variance was left unexplained by the Exo model (median 𝑅2 = 0.954 − 0.978), but only accounted for 72.4%–81.5% of the median variance in EMG during Exo gait across all individuals.

Interpretation:Discrepancy modeling successfully quantified individuals’ exoskeleton responses without requiring knowledge about physiological structure or motor control. However, additional measurement modalities and/or improved resolution are needed to characterize Exo gait, as the discrepancy may not comprehensively capture response due to unexplained variance in Exo gait.

KM Steele, MH Schwartz (2022) “Causal Effects of Motor Control on Gait Kinematics After Orthopedic Surgery in Cerebral Palsy: A Machine-Learning Approach”

Journal Article in Frontiers in Human Neuroscience

Altered motor control is common in cerebral palsy (CP). Understanding how altered motor control affects movement and treatment outcomes is important but challenging due to complex interactions with other neuromuscular impairments. While regression can be used to examine associations between impairments and movement, causal modeling provides a mathematical framework to specify assumed causal relationships, identify covariates that may introduce bias, and test model plausibility.
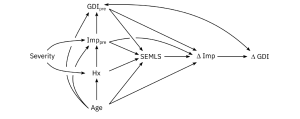
FIGURE 1 Directed Acyclic Graph (DAG) describing the assumed causal relationships between SEMLS (exposure) and 1GDI (outcome). The causal relationship between SEMLS and 1GDI is mediated by changes in impairments (1Imp). Baseline GDI (GDIpre) and 1GDI are related by measurement methods and other, unmeasured factors. Baseline impairment (Imppre), surgical history (Hx), and Age are also included as causal factors. The DAG also includes unmeasured factors related to general CP severity, which impact baseline impairment and surgical history. The step-by-step process and rationale for this DAG are available in the Supplementary Material and an interactive version is available on dagitty (http://dagitty.net/mUCSPWo).Aim: The goal of this research was to quantify the causal effects of altered motor control and other impairments on gait, before and after single-event multi-level orthopedic surgery (SEMLS).

Methods: We evaluated the impact of SEMLS on change in Gait Deviation Index (ΔGDI) between gait analyses. We constructed our causal model with a Directed Acyclic Graph that included the assumed causal relationships between SEMLS, ΔGDI, baseline GDI (GDIpre), baseline neurologic and orthopedic impairments (Imppre), age, and surgical history. We identified the adjustment set to evaluate the causal effect of SEMLS on ΔGDI and the impact of Imppre on ΔGDI and GDIpre. We used Bayesian Additive Regression Trees (BART) and accumulated local effects to assess relative effects.

Results: We prospectively recruited a cohort of children with bilateral CP undergoing SEMLS (N = 55, 35 males, age: 10.5 ± 3.1 years) and identified a control cohort with bilateral CP who did not undergo SEMLS (N = 55, 30 males, age: 10.0 ± 3.4 years). There was a small positive causal effect of SEMLS on ΔGDI (1.70 GDI points). Altered motor control (i.e., dynamic and static motor control) and strength had strong effects on GDIpre, but minimal effects on ΔGDI. Spasticity and orthopedic impairments had minimal effects on GDIpre or ΔGDI.

Interpretation: Altered motor control did have a strong effect on GDIpre, indicating that these impairments do have a causal effect on a child’s gait pattern, but minimal effect on expected changes in GDI after SEMLS. Heterogeneity in outcomes suggests there are other factors contributing to changes in gait. Identifying these factors and employing causal methods to examine the complex relationships between impairments and movement will be required to advance our understanding and care of children with CP.
MC Rosenberg, BS Banjanin, SA Burden, KM Steele (2020) “Predicting walking response to ankle exoskeleton using data driven models”

Journal Article in The Royal Society:

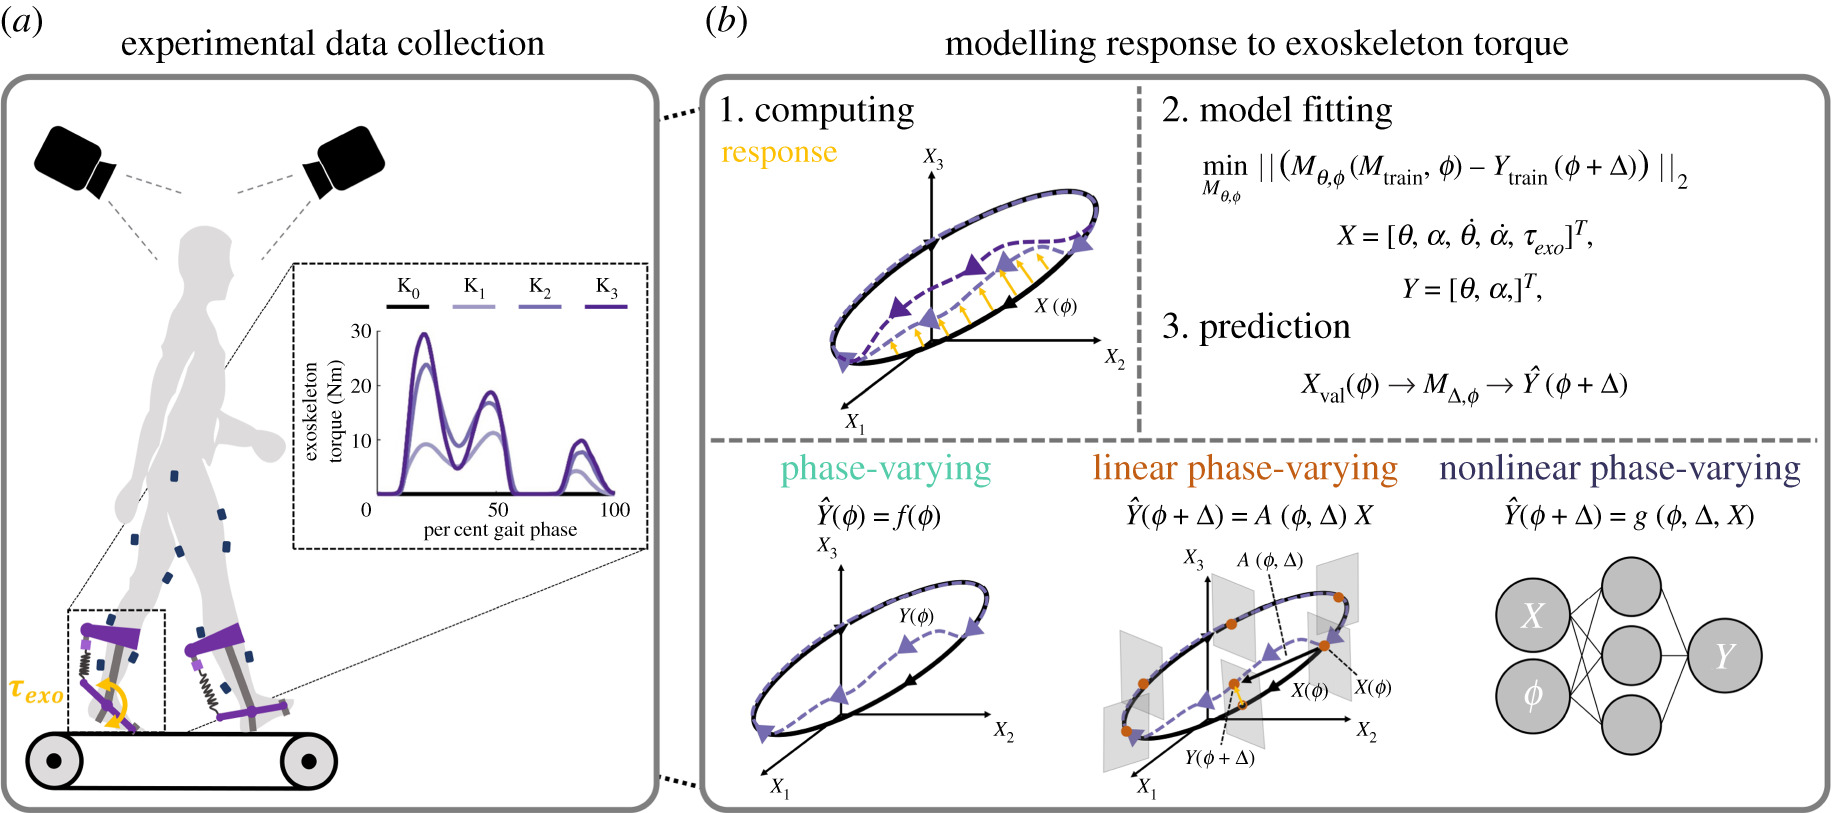
This work highlights the potential of data-driven models grounded in dynamical systems theory to predict complex individualized responses to ankle exoskeletons., without requiring explicit knowledge of the individual’s physiology or motor control

silhouette walking on left with purple lines and projections on right elipsoids and colored spheres

Aim: Evaluate the ability of three classes of subject-specific phase-varying (PV) models to predict kinematic and myoelectric responses to ankle exoskeletons during walking, without requiring prior knowledge of specific user characteristics.

Method: Data from 12 unimpaired adults walking with bilateral passive ankle exoskeletons were captured. PV, linear PV (LPV), and nonlinear PV (NPV) models leveraged Floquet theory to kinematics and muscle activity in response to three exoskeleton torque conditions.

Results: The LPV model’s predictions were more accurate than the PV model when predicting less than 12.5% of a stride in the future and explained 49–70% of the variance in hip, knee and ankle kinematic responses to torque. The LPV model also predicted kinematic responses with similar accuracy to the more-complex NPV model. Myoelectric responses were challenging to predict with all models, explaining at most 10% of the variance in responses.

Interpretation: This work highlights the potential of data-driven PV models to predict complex subject-specific responses to ankle exoskeletons and inform device design and control.

NL Zaino, KM Steele, JM Donelan, MH Schwartz (2020) “Energy consumption does not change after selective dorsal rhizotomy in children with spastic cerebral palsy” Developmental Medicine & Child Neurology

Journal Article in Developmental Medicine & Child Neurology:

This retrospective analysis demonstrated that energy consumption is not reduced after rhizotomy when compared to matched controls with cerebral palsy.

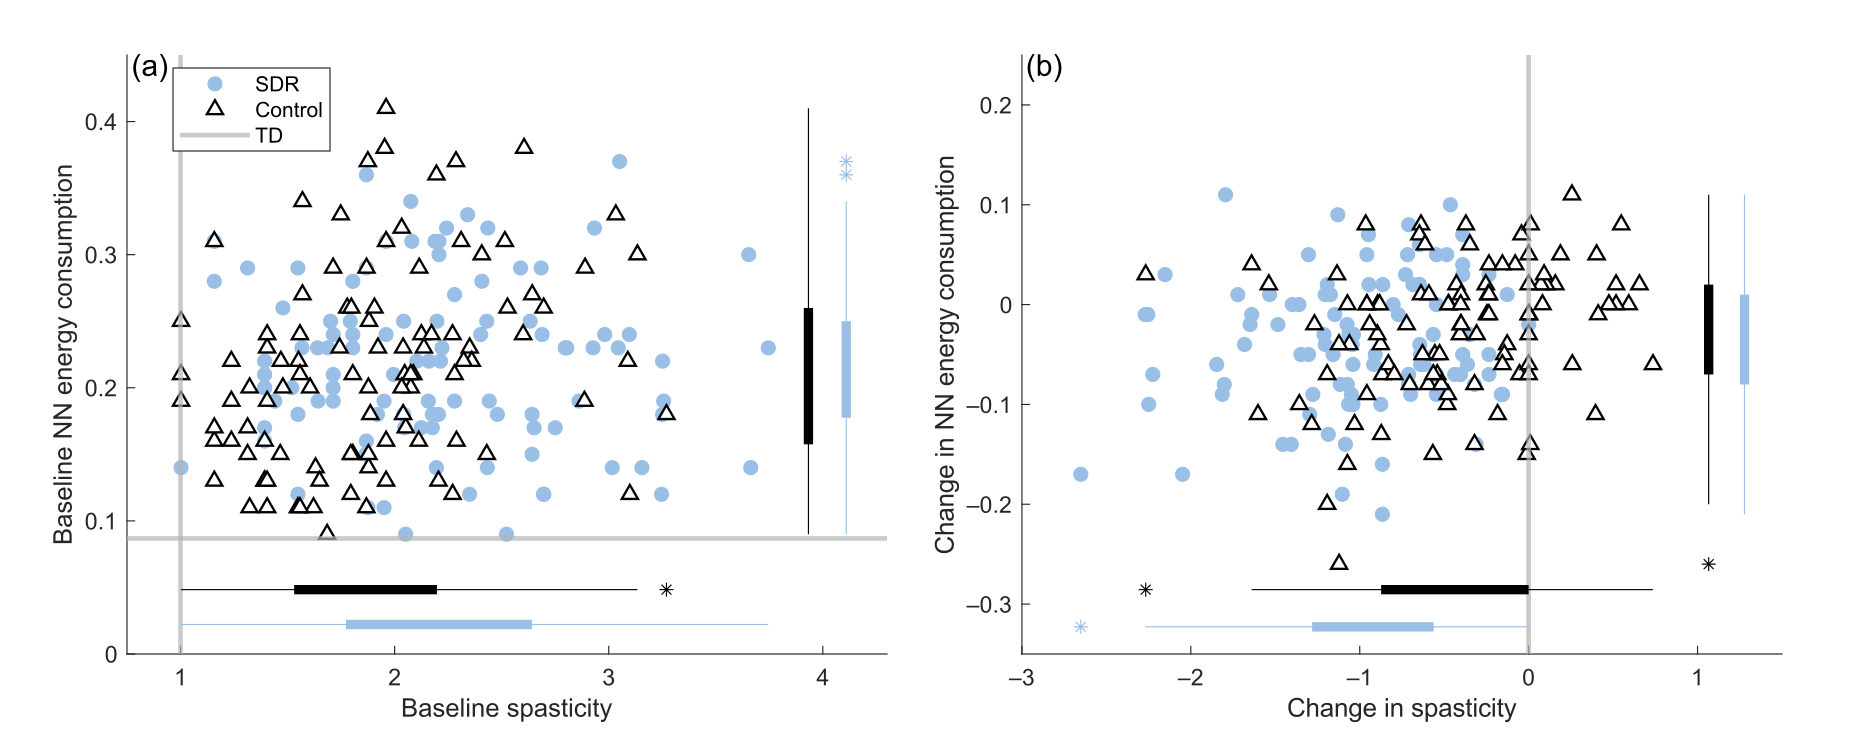
Spasticity and net-nondimensionalized (NN) energy consumption for children with cerebral palsy (CP) who underwent a selective dorsal rhizotomy (SDR) and matched peers with CP who did not undergo SDR (control). (a) Baseline spasticity and NN energy consumption were similar between groups. Gray lines show normative values for typically developing (TD) peers from Gillette Children’s Specialty Healthcare. (b) Spasticity and NN energy consumption decreased significantly at follow-up for both groups. The SDR cohort had a significantly greater decrease in spasticity compared to the no-SDR group, but a similar decrease in NN energy consumption. Bars represent distributions for each group including outliers (*).

Aim: To determine whether energy consumption changes after selective dorsal rhizotomy (SDR) among children with cerebral palsy (CP).

Method: We retrospectively evaluated net nondimensional energy consumption during walking among 101 children with bilateral spastic CP who underwent SDR (59 males, 42 females; median age [5th centile, 95th centile] 5y 8mo [4y 2mo, 9y 4mo]) compared to a control group of children with CP who did not undergo SDR. The control group was matched by baseline age, spasticity, and energy consumption (56 males, 45 females; median age [5th centile, 95th centile] 5y 8mo [4y 1mo, 9y 6mo]). Outcomes were compared at baseline and follow‐up (SDR: mean [SD] 1y 7mo [6mo], control: 1y 8mo [8mo]).

Results: The SDR group had significantly greater decreases in spasticity compared to matched controls (–42% SDR vs –20% control, p<0.001). While both groups had a modest reduction in energy consumption between visits (–12% SDR, –7% control), there was no difference in change in energy consumption (p=0.11) or walking speed (p=0.56) between groups.

Interpretation: The SDR group did not exhibit greater reductions in energy consumption compared to controls. The SDR group had significantly greater spasticity reduction, suggesting that spasticity had minimal impact on energy consumption during walking in CP. These results support prior findings that spasticity and energy consumption decrease with age in CP. Identifying matched control groups is critical for outcomes research involving children with CP to account for developmental changes.

B Nguyen, N Baicoianu, D Howell, KM Peters, KM Steele (2020) “Accuracy and repeatability of smartphone sensors for measuring shank-to-vertical angle” Prosthetics & Orthotics International

Journal Article in Prosthetics & Orthotics International

Example of how the smartphone app was used for this research. The top images show a black smartphone attached with a running arm band to the side or front of the shank - the two positions tested in this research. The middle figure shows the placement of the reflective markers for 3D motion analysis to evaluate the accuracy of the smartphone measurements. Markers were placed on the lateral epicondyle of the knee, lateral maleolus of the ankle, tibial tuberosity, and the distal tibia. Blacklight was used to mark the position of each marker and hide the position from the clinicians. The bottom panel shows screenshots from the app. The first screen is used to align the device and has arrows at the top and bottom that remind the clinician which anatomical landmarks should be used to align the device while displaying the shank-to-vertical angle in real time. The second screenshot shows an example of the calculated shank-to-vertical angle while someone was walking. The average is shown with a bold black line, with all other trials shown in blue and excluded trials (e.g., when someone was stopping or turning) that deviated more than one standard deviation from other trials are shown in red. There is also text below the graph that provides summary measures, like shank-to-vertical angle in mid stand and cadence (steps/min). The results can be exported as a picture or sent via e-mail using the app.
A) Smartphone positioning on the front or side of the shank. B) Reflective markers on the the tibial tuberosity (TT) – distal tibia (DT) and lateral epicondyle (LE) – lateral malleolus (LM) were used to compare the accuracy of the smartphone to traditional motion capture. UV markings were used to keep placement of these markers constant while blinding clinicians. C) Sample screenshots of the mobile application, including the set-up screen and results automatically produced after a walking trial.

Background

Assessments of human movement are clinically important. However, accurate measurements are often unavailable due to the need for expensive equipment or intensive processing. For orthotists and therapists, shank-to-vertical angle (SVA) is one critical measure used to assess gait and guide prescriptions. Smartphone-based sensors may provide a widely-available platform to expand access to quantitative assessments.

Objectives

Assess accuracy and repeatability of smartphone-based measurement of SVA compared to marker-based 3D motion analysis.

Method

Four licensed clinicians (two physical therapists and two orthotists) measured SVA during gait with a smartphone attached to the anterior or lateral shank surface of unimpaired adults.  We compared SVA calculated from the smartphone’s inertial measurement unit to marker-based measurements. Each clinician completed three sessions/day on two days with each participant to assess repeatability.

Results

Average absolute differences in SVA measured with a smartphone versus marker-based 3D motion analysis during gait were 0.67 ± 0.25° and 4.89 ± 0.72°, with anterior or lateral smartphone positions, respectively. The inter- and intra-day repeatability of SVA were within 2° for both smartphone positions.

Conclusions

Smartphone sensors can be used to measure SVA with high accuracy and repeatability during unimpaired gait, providing a widely-available tool for quantitative gait assessments.

Try it out!

The app for monitoring shank-to-vertical angle is available for you to download and use on either Android or iOS smartphone. Please complete THIS SURVEY which will then send you an e-mail with instructions for installation and use. This app is not an FDA approved medical device and should be used appropriately.