The Ability & Innovation Lab’s own Alyssa Spomer was featured in an article, Supporting mobility in cerebral palsy, via the Department of Mechanical Engineering. This article highlighted her work on how a robotic exoskeleton device paired with real-time feedback can enhance rehabilitation therapy for children with cerebral palsy. Way to go Alyssa!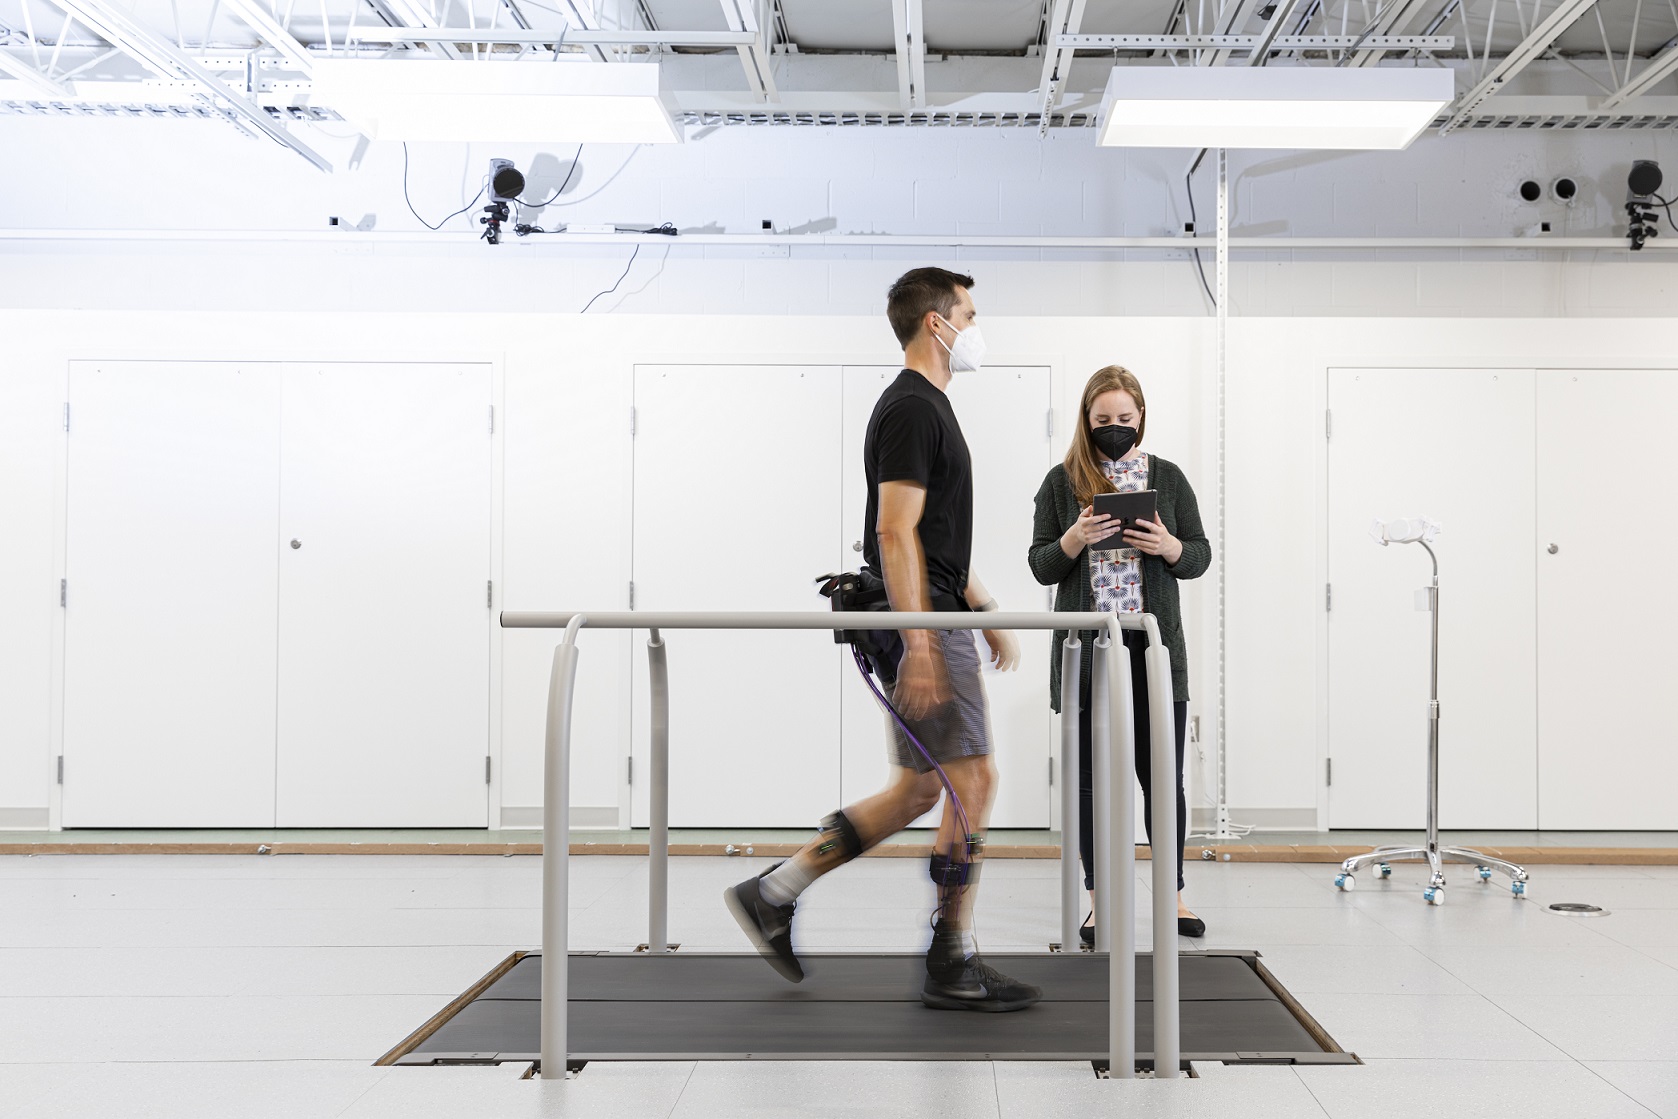
BC Conner, AM Spomer, SSPA Bishe, KM Steele, ZF Lerner (2022) “Soleus H-reflex modulation in cerebral palsy and its relationship with neural control complexity: a pilot study”
Journal Article in Experimental Brain Research
Individuals with cerebral palsy (CP) display motor control patterns that suggest decreased supraspinal input, but it remains unknown if they are able to modulate lower-limb reflexes in response to more complex tasks, or whether global motor control patterns relate to reflex modulation capacity in this population.
 Aim: To further elucidate the multifaceted effects of CP on inhibitory and faciliatory supraspinal pathways and global measures of motor control, providing novel information for improving targeted neuromuscular interventions in this patient population.
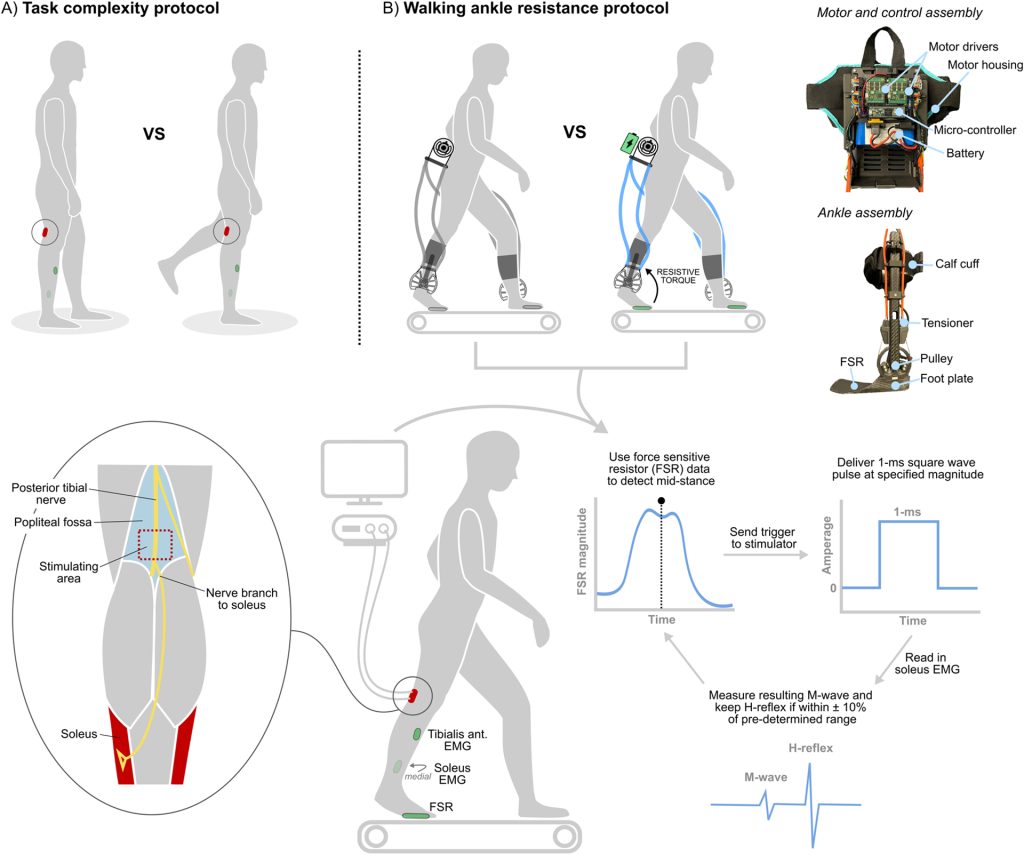
Methods: Eight ambulatory individuals with CP (12–18 years old) were recruited to complete a task complexity protocol, where soleus H-reflex excitability was compared between bilateral (baseline) and unilateral (complex) standing. We also investigated the relationship between each participant’s ability to modulate soleus H-reflex excitability and the complexity of their walking neural control pattern determined from muscle synergy analysis. Finally, six of the eight participants completed an exoskeleton walking protocol, where soleus H-reflexes were collected during the stance phase of walking with and without stance-phase plantar flexor resistance.
Results: Participants displayed a significant reduction in soleus H-reflex excitability (− 26 ± 25%, p = 0.04) with unilateral standing, and a strong positive relationship was observed between more refined neural control during walking and an increased ability to modulate reflex excitability (R = 0.79, p = 0.04). There was no difference in neuromuscular outcome measures with and without the ankle exoskeleton (p values all > 0.05), with variable reflex responses to walking with ankle exoskeleton resistance.
Interpretation: These findings provide evidence that ambulatory individuals with CP retain some capacity to modulate lower-limb reflexes in response to increased task complexity, and that less refined neural control during walking appears to be related to deficits in reflex modulation.
KM Steele, MH Schwartz (2022) “Causal Effects of Motor Control on Gait Kinematics After Orthopedic Surgery in Cerebral Palsy: A Machine-Learning Approach”
Journal Article in Frontiers in Human Neuroscience
Altered motor control is common in cerebral palsy (CP). Understanding how altered motor control affects movement and treatment outcomes is important but challenging due to complex interactions with other neuromuscular impairments. While regression can be used to examine associations between impairments and movement, causal modeling provides a mathematical framework to specify assumed causal relationships, identify covariates that may introduce bias, and test model plausibility.
 Aim: The goal of this research was to quantify the causal effects of altered motor control and other impairments on gait, before and after single-event multi-level orthopedic surgery (SEMLS).
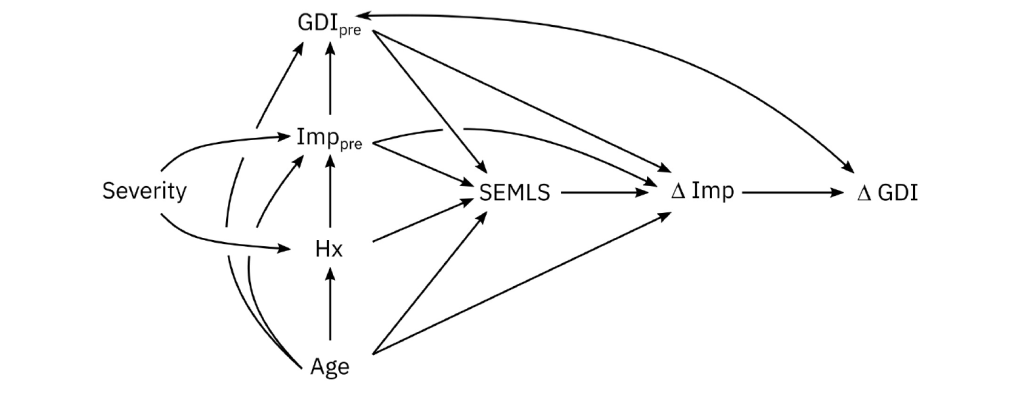
Methods: We evaluated the impact of SEMLS on change in Gait Deviation Index (ΔGDI) between gait analyses. We constructed our causal model with a Directed Acyclic Graph that included the assumed causal relationships between SEMLS, ΔGDI, baseline GDI (GDIpre), baseline neurologic and orthopedic impairments (Imppre), age, and surgical history. We identified the adjustment set to evaluate the causal effect of SEMLS on ΔGDI and the impact of Imppre on ΔGDI and GDIpre. We used Bayesian Additive Regression Trees (BART) and accumulated local effects to assess relative effects.
Results: We prospectively recruited a cohort of children with bilateral CP undergoing SEMLS (N = 55, 35 males, age: 10.5 ± 3.1 years) and identified a control cohort with bilateral CP who did not undergo SEMLS (N = 55, 30 males, age: 10.0 ± 3.4 years). There was a small positive causal effect of SEMLS on ΔGDI (1.70 GDI points). Altered motor control (i.e., dynamic and static motor control) and strength had strong effects on GDIpre, but minimal effects on ΔGDI. Spasticity and orthopedic impairments had minimal effects on GDIpre or ΔGDI.
Interpretation: Altered motor control did have a strong effect on GDIpre, indicating that these impairments do have a causal effect on a child’s gait pattern, but minimal effect on expected changes in GDI after SEMLS. Heterogeneity in outcomes suggests there are other factors contributing to changes in gait. Identifying these factors and employing causal methods to examine the complex relationships between impairments and movement will be required to advance our understanding and care of children with CP.
Introducing Dr. Yamagami
 Congratulations to Dr. Momona Yamagami on earning her Doctorate in Electrical and Computer Engineering! Dr. Yamagami’s PhD thesis dissertation was titled Modeling and enhancing human-machine interaction for accessibility and health. Congratulations and best of luck as you move forward as a CREATE Postdoctoral Researcher.
Members volunteer at 2022 Special Olympics Northwest Swimming Regionals
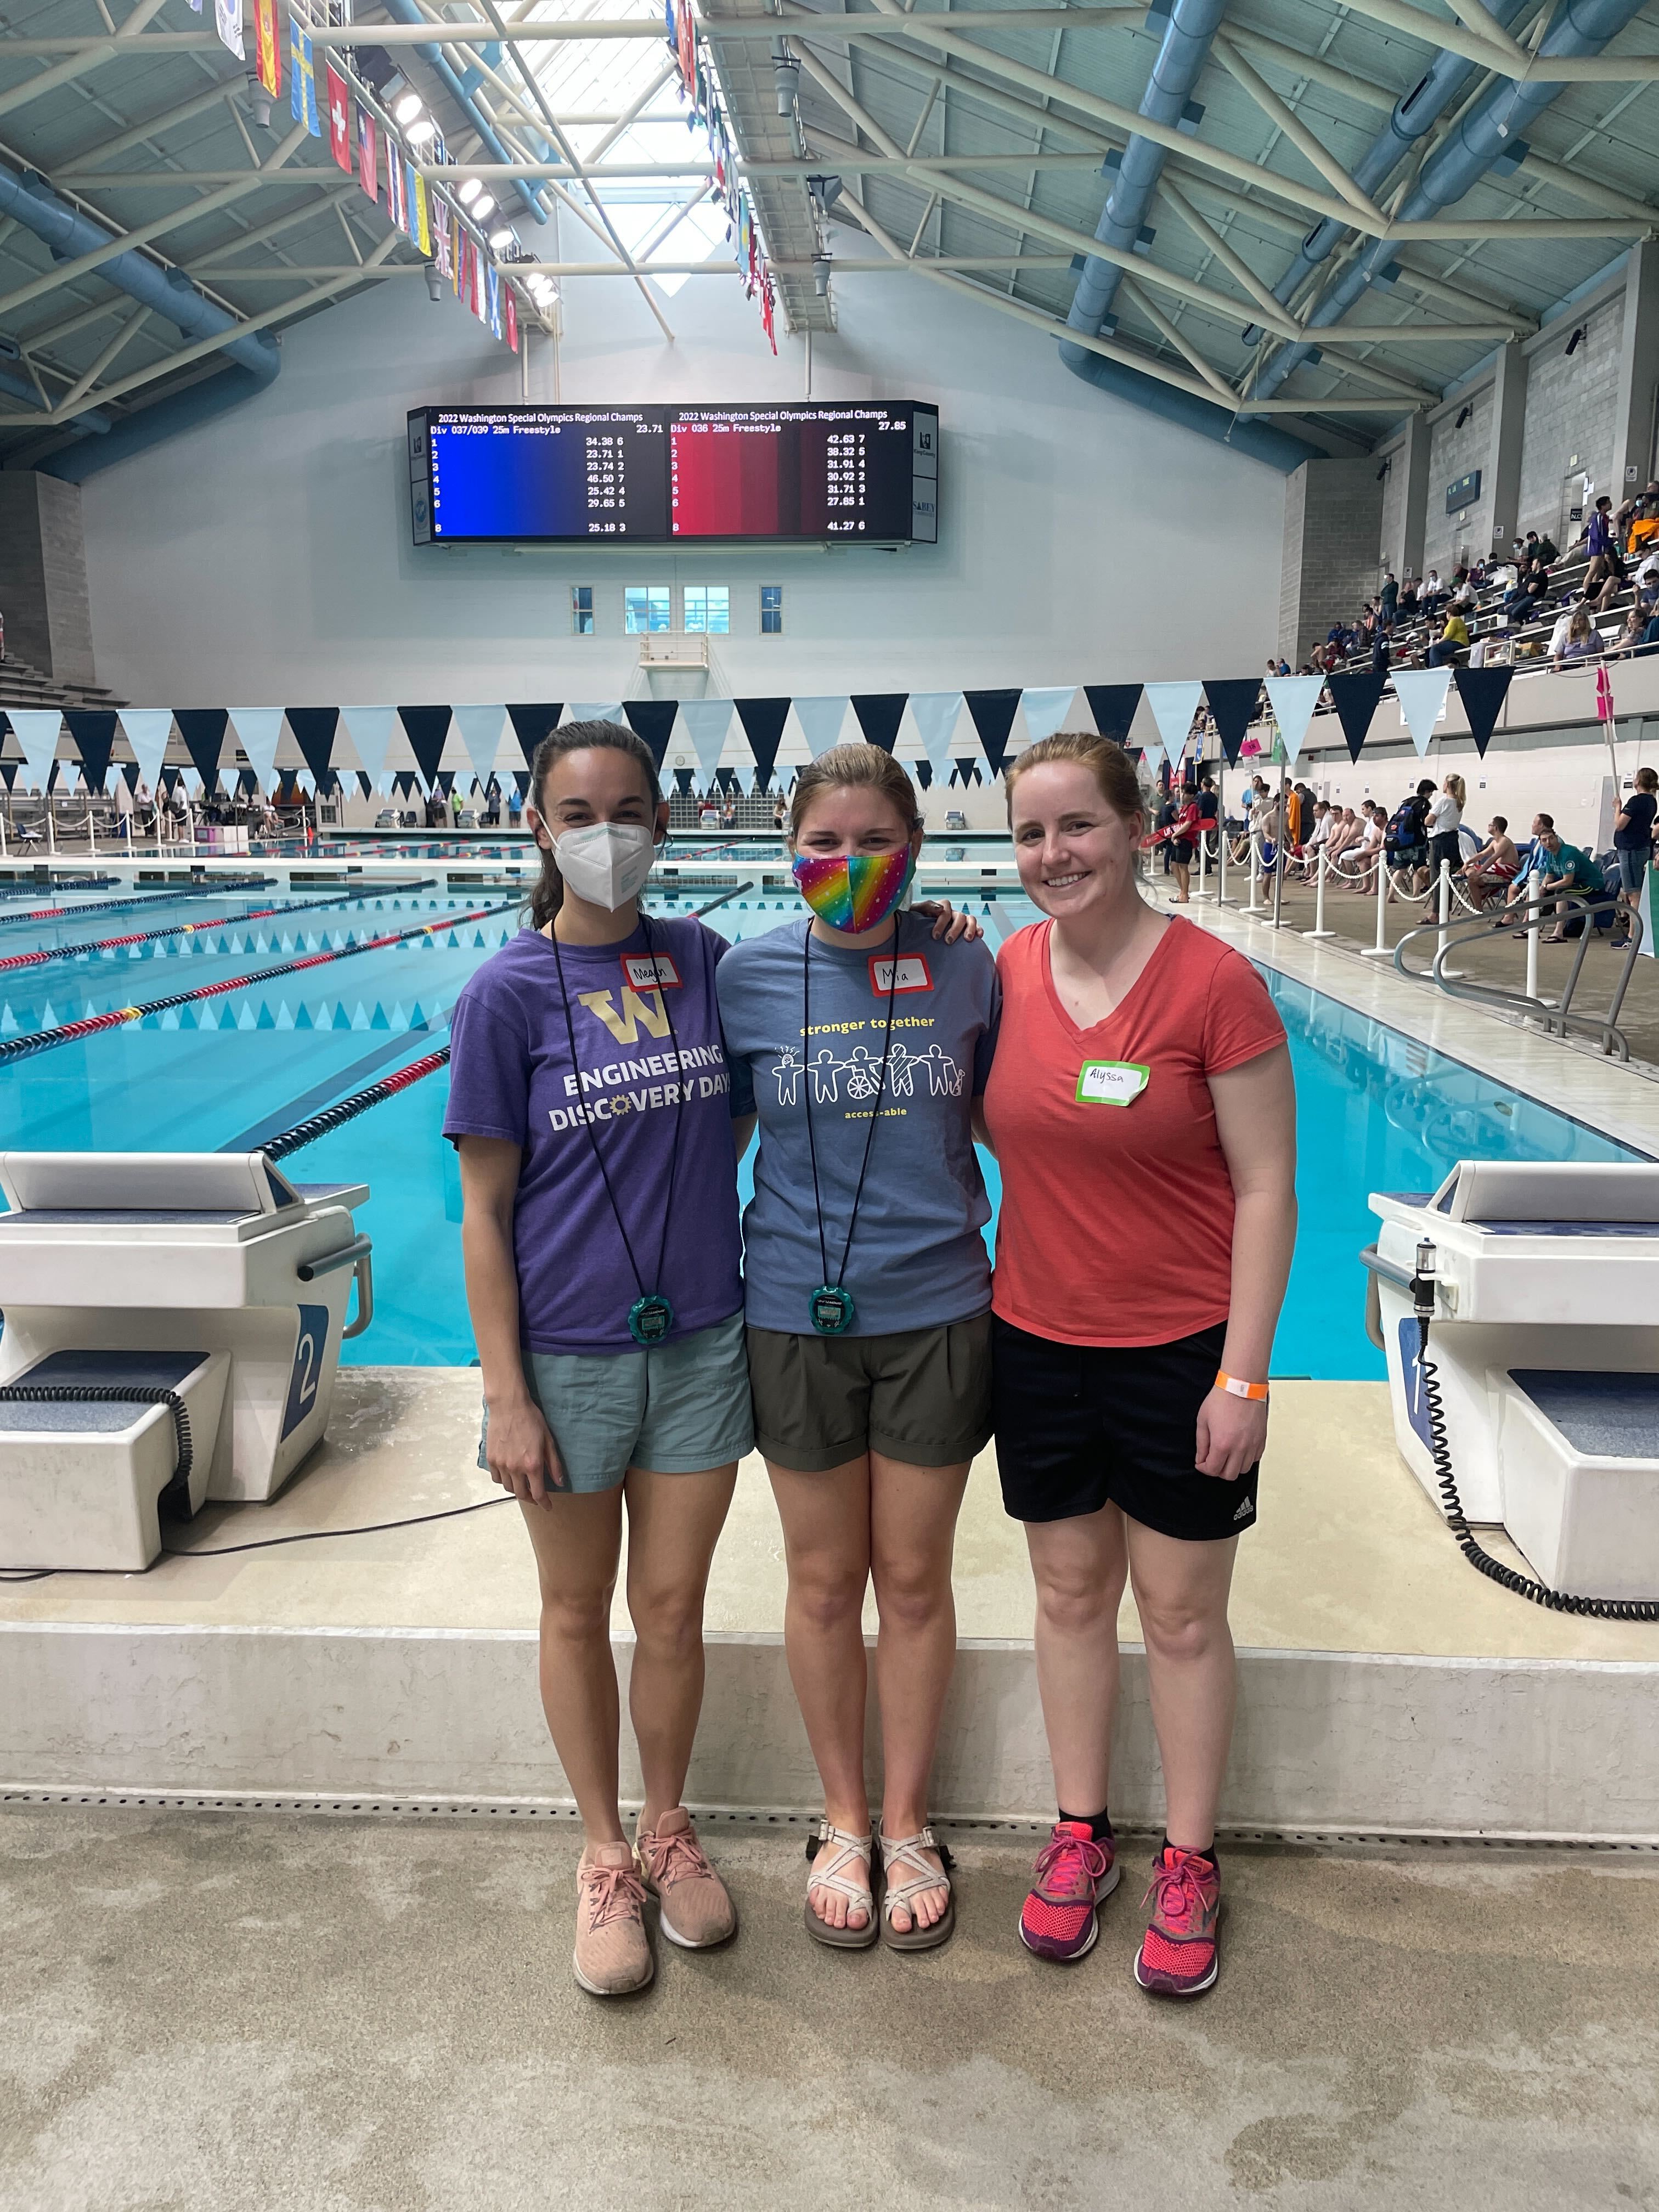 Megan Ebers, Mia Hoffman, and Alyssa Spomer volunteered at the Special Olympics Northwest Swimming Regionals. Congratulations to all of the athletes!